Walkthrough of a Google Lighthouse Report
In our recent post, How to Improve Search Engine Ranking in 2021 Using Google Lighthouse, I reviewed Google Lighthouse, how it works, and what each of the 4 different scores measure. Using that information, I am going to walk you through an example report so you can see what the information looks like as well as give some possible solutions to any issues that Lighthouse uncovers. We cover a lot of this in a previous post, so click the link or feel free to hit us up in the comments. Let's get started!
The Initial Dashboard
I decided to use a familiar brand’s ecommerce website to test with Google Lighthouse - Yeti.com. After I enter the Yeti homepage url and hit the TEST button, 4 main scores are shown: Performance, Accessibility, Best practices, and SEO.
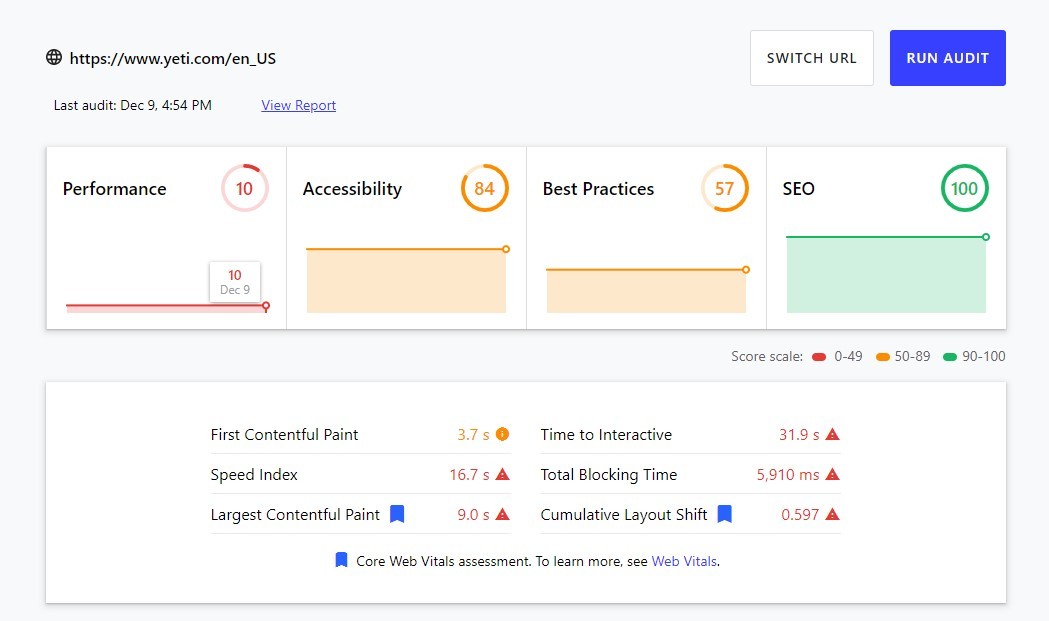
Each of these scores have a range from 0 to 100 and are also color-coded with either red, yellow or green. A red number indicates POOR (score ranging from 0 to 49), a yellow number indicates NEEDS IMPROVEMENT (score ranging from 51 to 89), and a green number indicates GOOD (score ranging from 90 to 100).
In our example, you can see that Yeti seems to have a lot of work to do if they want to improve their Performance score, which came in at a mere 10. A score this low, especially compared to the other 3 sections, would dictate that this section should be their top priority. Yeti’s SEO received a score of 100, meaning there isn’t anything to be improved upon here beyond monitoring it every so often. Both Accessibility and Best Practices scored in the Needs Improvement designation.
When we look deeper into the report, we will be able to see the recommended improvements to make that might be able to increase these scores. I usually make a note of any recommendations that are quick and easy to implement so they can be completed and hopefully have an immediate impact on the site. Otherwise, Yeti’s efforts should likely focus on the Performance issues.
Now let's take a look at the full report by clicking the View Report link at the top.
Performance (Score: 10)
Performance is the first section you’ll see at the top and is broken down in 4 sections.
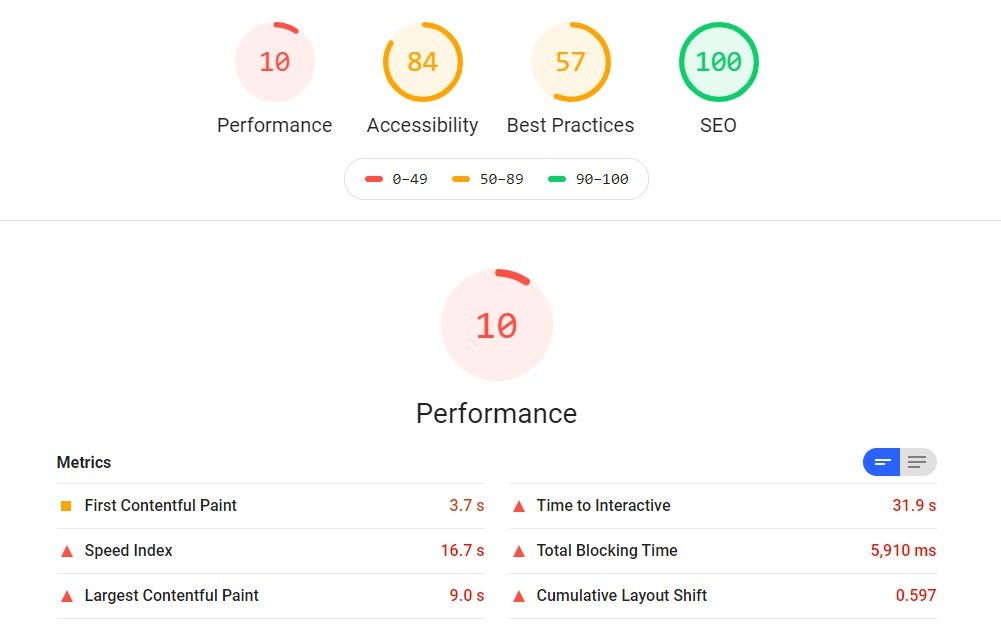
1. Metrics
Six core metrics are shown in this section. If you’re not sure what these metrics mean, refer back to my initial Google Lighthouse post.
In the snapshot above, you’ll notice there is either an orange square or a red triangle next to each metric. The orange square tells us that our First Contentful Paint measurement isn’t terrible, but there’s still room for improvement. The red triangle tells us that the other five metrics scored poorly compared to Google’s expectations. Basically, the page is both loading and reacting slowly, which often leads to poor user experience.
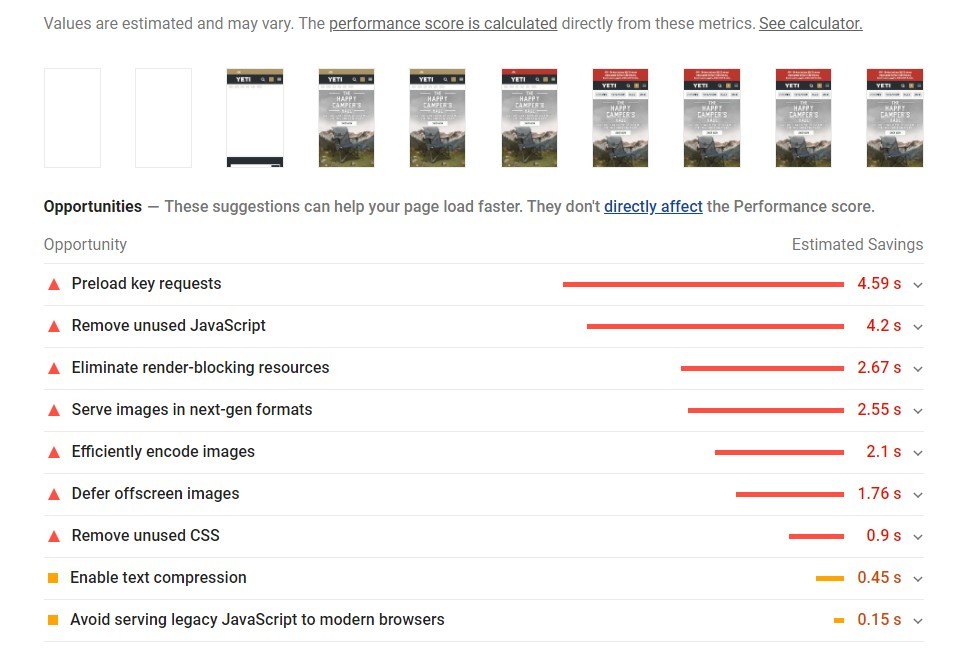
2. Opportunities
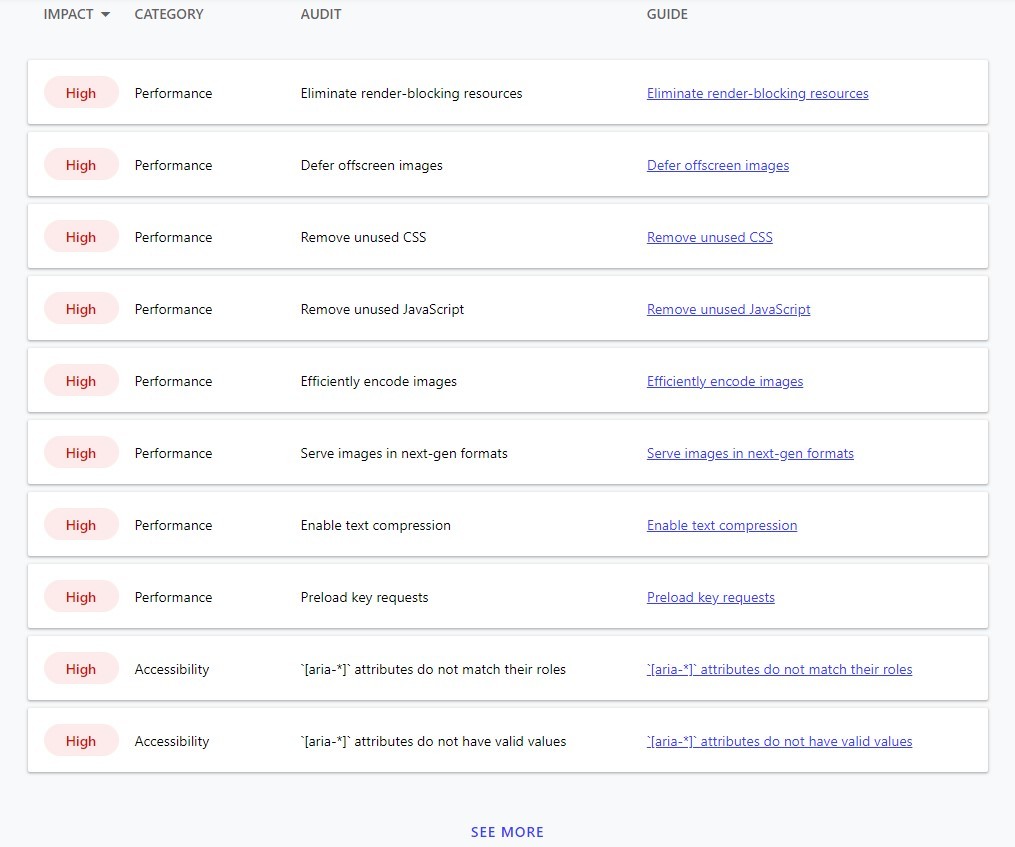
This is the section where Google Lighthouse lists out suggestions which could potentially help your page(s) load faster. It’s important to understand that the opportunities listed do not directly affect your performance score, but will likely have a positive impact on your page speed.
In this section, you’ll see that the same colored shapes are used for each opportunity. The shapes indicate the priority level of each suggestion, with red triangles being high priorities, orange squares being medium priorities, and gray circles being low priorities.
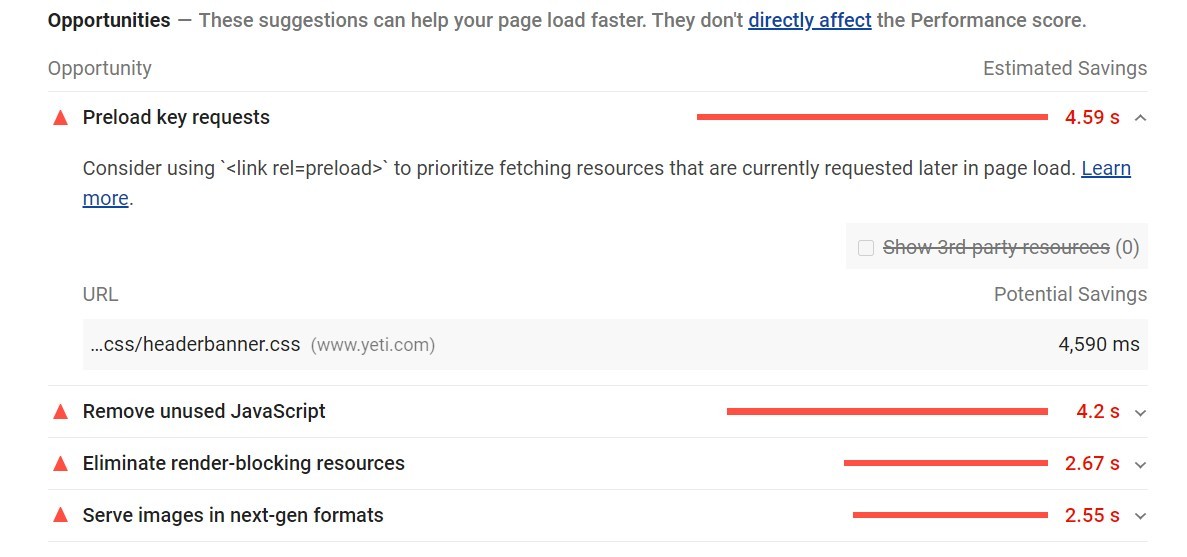
You can get more detailed information regarding each opportunity by clicking the arrow all the way to the right. This is where you will find a solution(s) to help fix the issue(s). For example, if we drop down Preload Key Requests, Google recommends using <link rel=preload> to prioritize fetching resources. If you’re not familiar with the solutions presented, you can click on the Learn More link next to each opportunity for additional clarification.
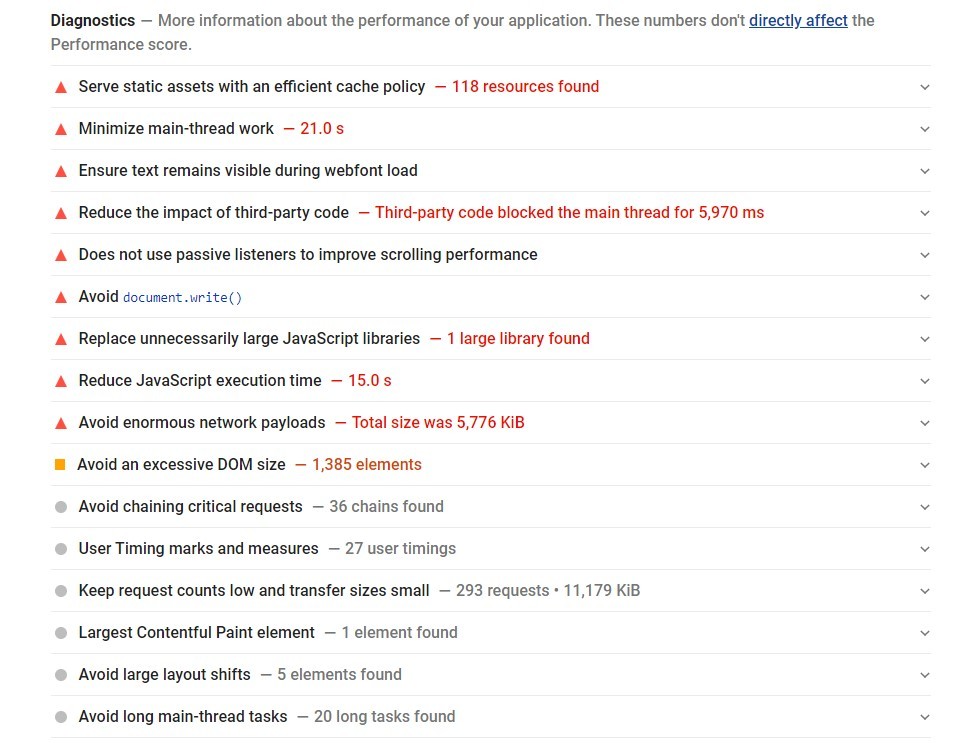
3. Diagnostics
The Diagnostics section is similar to the Opportunities section except that instead of page speed and load time, Diagnostics measure how your application performs and reacts. Once again, the suggestions for improvement shown here do not directly affect your performance score, but completing these tasks will likely improve how your website performs.
4. Passed Audits
In this section you can see all of the audits that passed. As recommended tasks are completed, the associated audits will appear here after you retest your page.
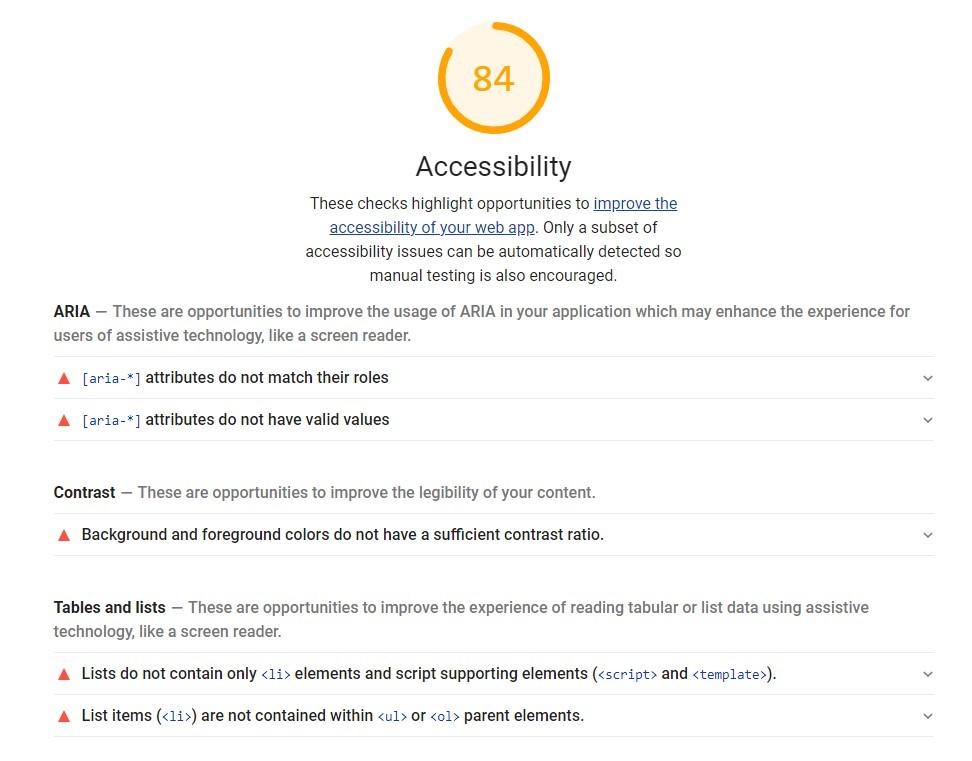
Accessibility (Score: 84)
Yeti’s Accessibility score was 84, which is only 6 points away from a passing score of 90. Seeing that this score is so close to the next tier, I think it would be a good idea to review Google’s recommended improvements to see if there are any quick fixes that could potentially boost the Accessibility score up into the GOOD tier. If not, I would likely proceed with fixing the Performance issues.
One thing to note in the snapshot is the section Additional Items to Manually Check. These are elements which Google Lighthouse cannot automatically audit, but still are very important to the overall user experience of the page. They should be reviewed to ensure there are no glaring problems that might keep users from staying on the page or converting.
Since we don’t know exactly how the Yeti website operates, it’s impossible to estimate the time it would take to implement many of the recommendations that are given. If this was my website, I would knock out any quick fixes designated with a red triangle (high priority) first, then work on the more involved tasks later on. This approach will allow Google to re-evaluate the site with some fixes made sooner rather than later.
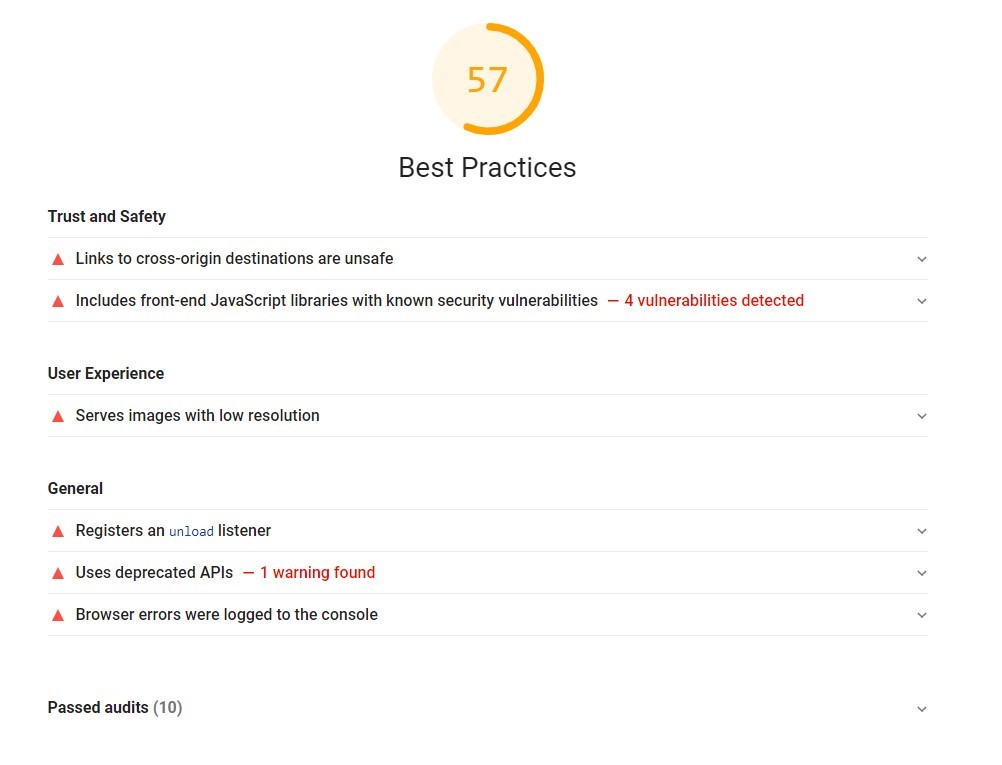
Best Practices (Score: 57)
The Best Practices score came in just above the Poor threshold at 57, but surprisingly there are not a lot of suggested improvements listed. What this tells me is that these improvements carry more weight with the overall Best Practices score and are important to Google’s ranking algorithm. I would classify these recommendations as a high priority once the Performance fixes have been implemented.
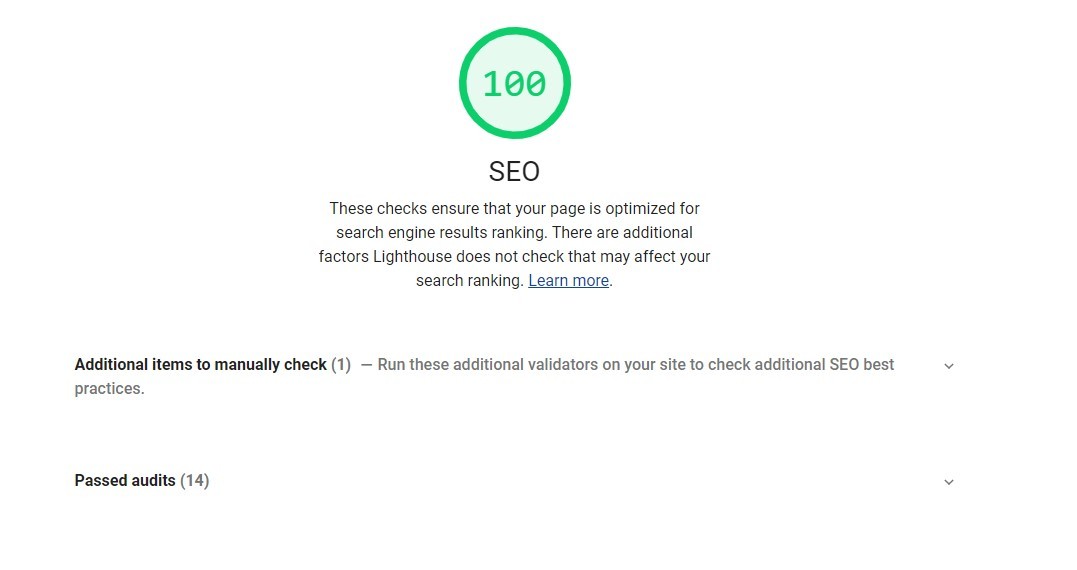
SEO (Score: 100)
As I stated earlier, there’s not much to do regarding SEO. The only task is to review any items that need to be manually checked. It’s also a good idea to click on the Passed Audits tab to get an idea of the different tests that Google Lighthouse ran on the page. Becoming familiar with the audits is important so we don’t make any future changes that might have a negative impact on our SEO score.
So, How Did Yeti Measure Up?
Overall, this website is in fairly good shape according to the Google Lighthouse report we just reviewed. I would say the primary goal would be to increase the Performance score to at least 50, as it should have a positive impact on both the ranking value and the user experience of the website. Over time, we would obviously want to work towards scores above 90 in all 4 major audits.
The next step after reviewing a Google Lighthouse report is to bring in the necessary team members who have the ability to analyze and implement the recommendations that need to be made. They will be able to more accurately estimate the time and effort it would take to make the changes, help prioritize what should be tackled first, and divide up the work.
Have you measured your website yet? If you’ve reviewed your report but would like some further clarification, or you are looking for help with implementing any of the recommendations, feel free to send us a message. We’d be happy to answer any questions you have in order to get your website in the best position for success in 2021.
Shoot us a message and we'll be in touch asap!